Simple Excel Report
TIP
This guide showcases the integration capabilities of ACE360 Connect, but please be aware that we are not able to provide direct support for Power Automate implementations.
This example will show you how to use Microsoft Power Automate to automatically get all paginated apprentices and build a simple Excel report.
At the end of this example you should be able to create your own scheduled Power Automate flow to query the ACE360 Connect API, get apprentice data, and add data to an Excel report. This is just an example feel free to try different things and pick data that would be relevant to you.
Contents
Getting Started
Before you can create a Power Automate flow, you'll need access Power Automate itself. It is included with some Office 365 licenses, so if you're already an Office 365 customer check to see if access is included. Otherwise visit here and sign up. Keep in mind that this guide makes use of premium Power Automate features, if you don't have access to Power Automate Pro, you won't be able to follow along.
Your First Flow
Once your account is set up and you've logged in you should see something similar to this:
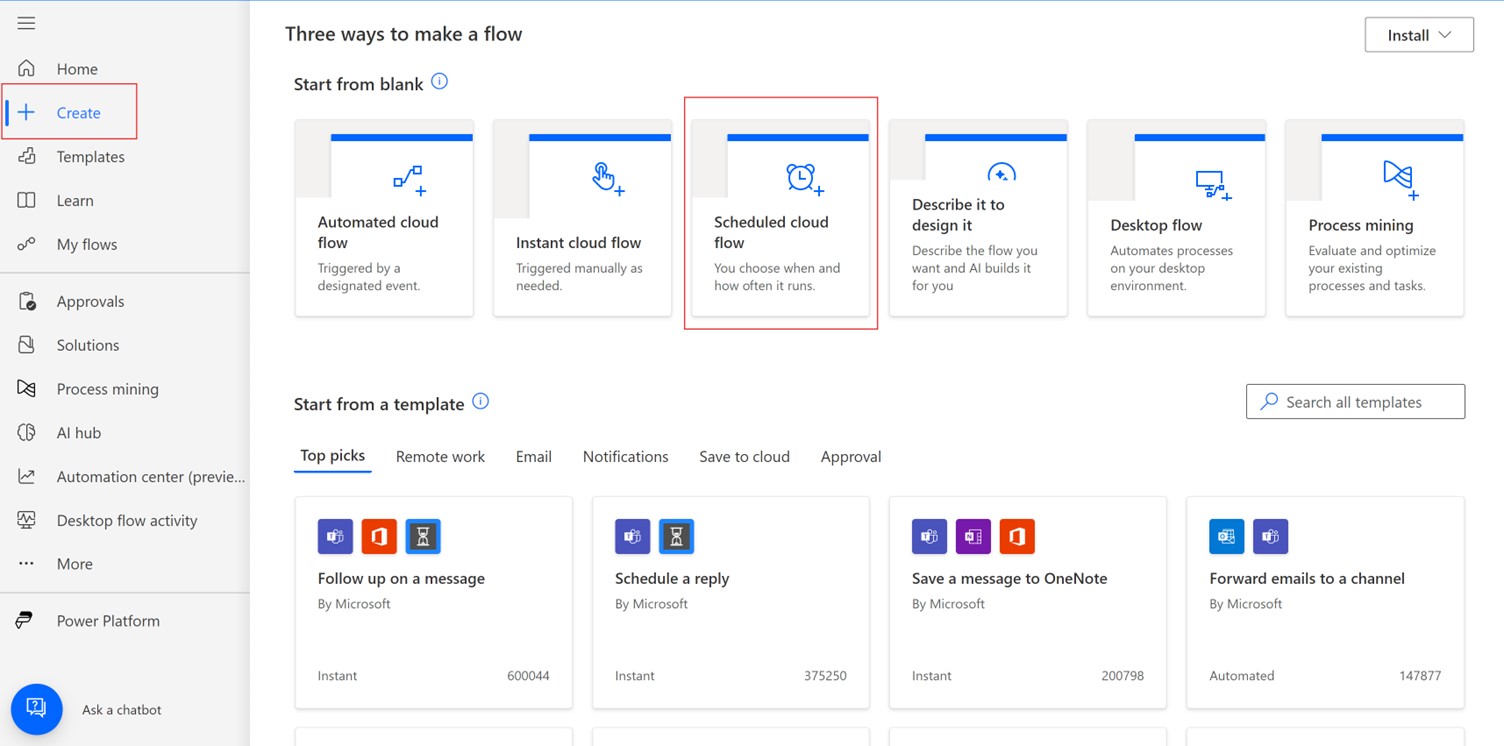
This dashboard makes things look pretty complicated. There's a lot going on! In this demo, we're only going to focus on setting up a single automated flow. We'll cover some of the other features and options in later demos.
Configuring Your Flow
Click "Create" from the navigation bar on the left and under the start from blank heading, select "Scheduled cloud flow".
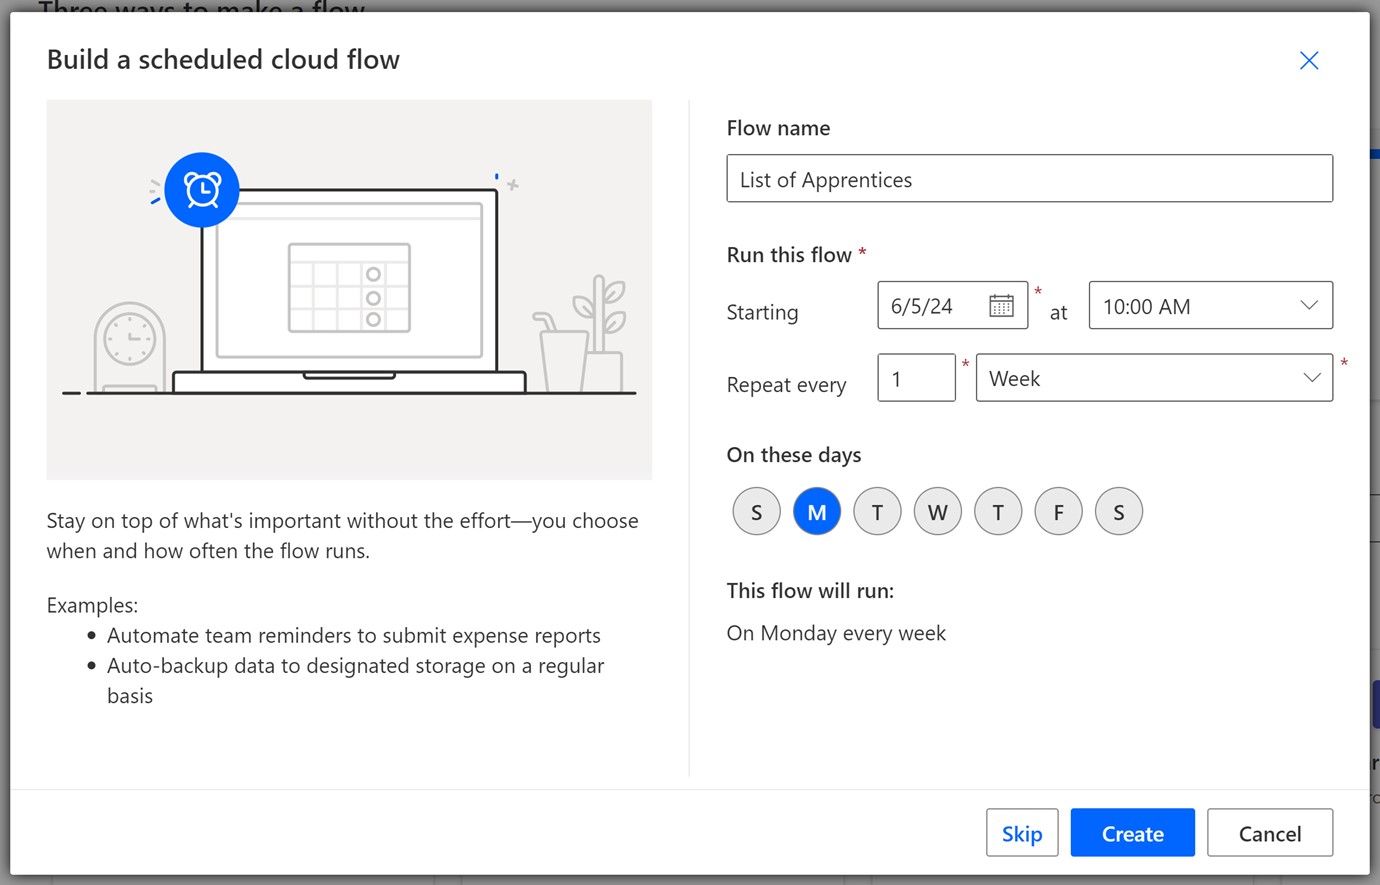
Add a name for your flow, for this example we'll use "List of Apprentices". (If you skip this step, Power Automate will generate a name for you)
Set the date, time, and the frequency you'd like this flow to run at. For this example we'll go with every week, on a monday, at 10:00 AM. Then at the bottom of the dialog click "Create".
Handling Your Data
To handle pagination, you need to initialize a variable that will be incremented for every page.
Note: ACE360 Connect returns paginated responses. This means we limit the amount of data returned in each request. To get all of your data you'll need to request each page of results.
Select "New Action" or the plus icon to add a new step to your flow.
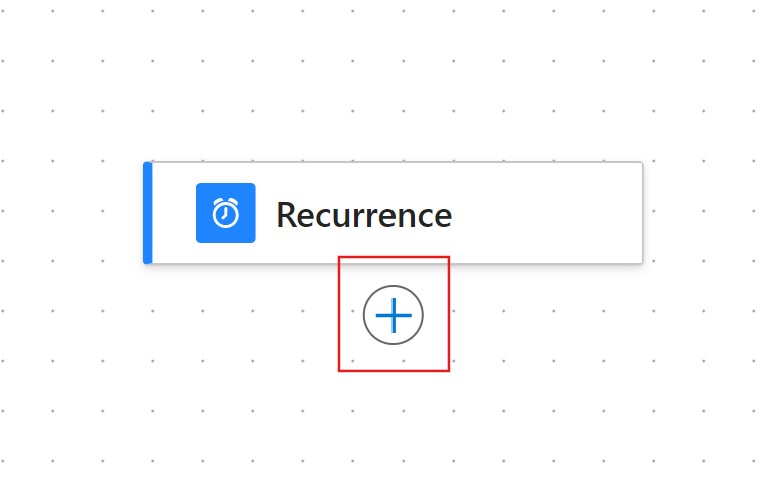
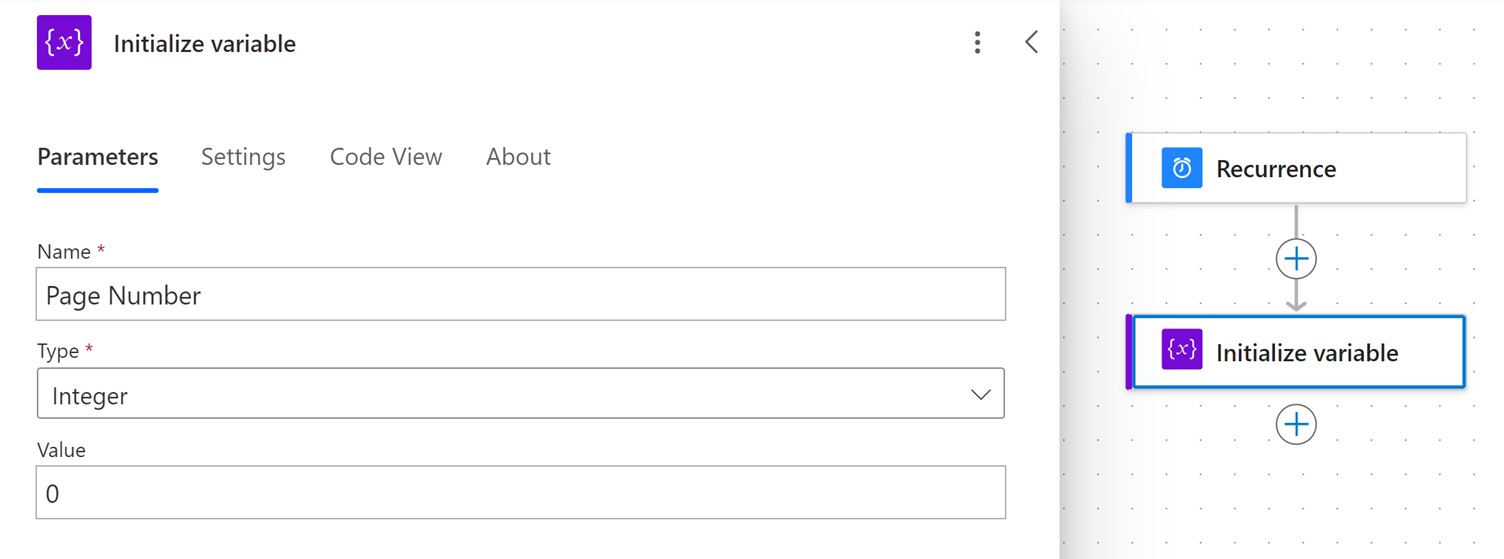
Search for "variable" and select the "Initialize variable" option under the Variable heading.
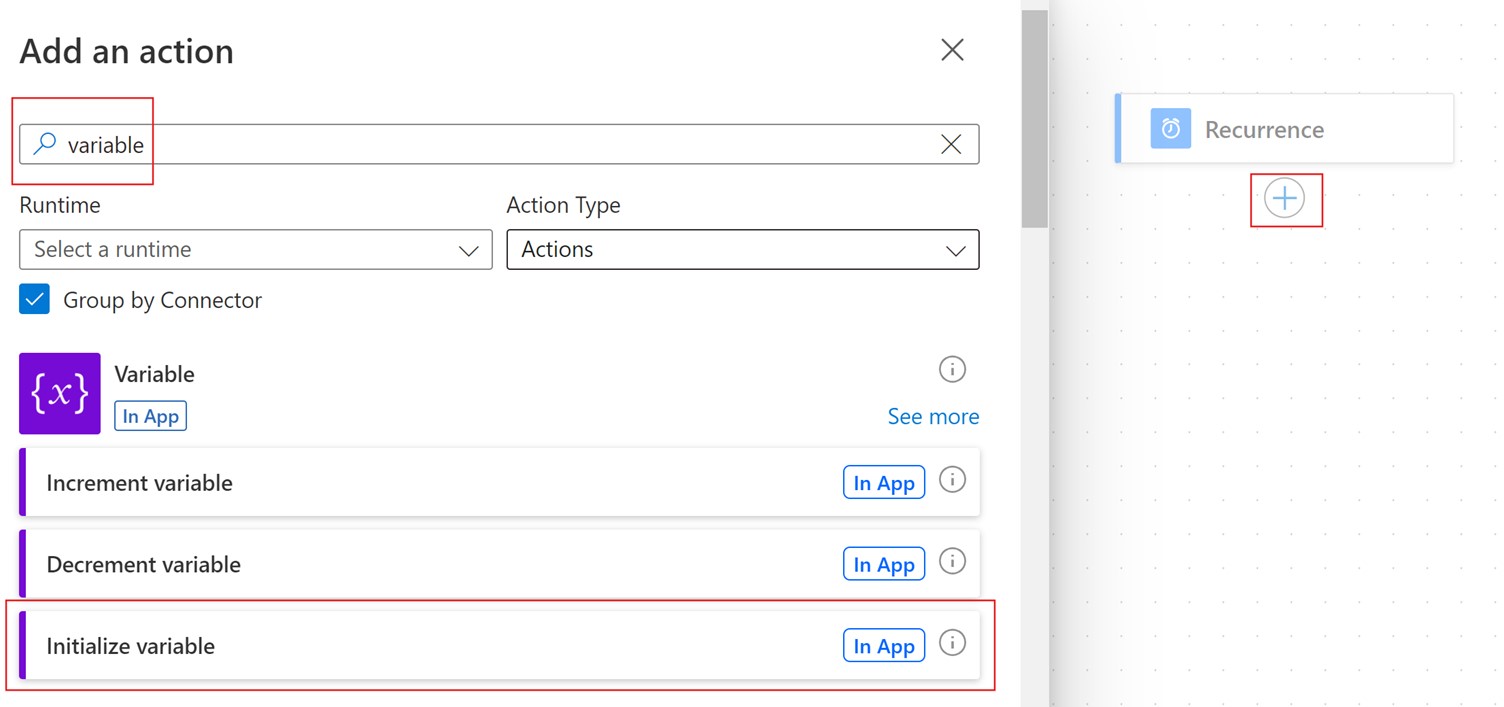
Fill out the Name, Type and Value of the variable as follows.
To increment the initialized variable for every page retrieved, another variable must be created to denote how much to increment by.
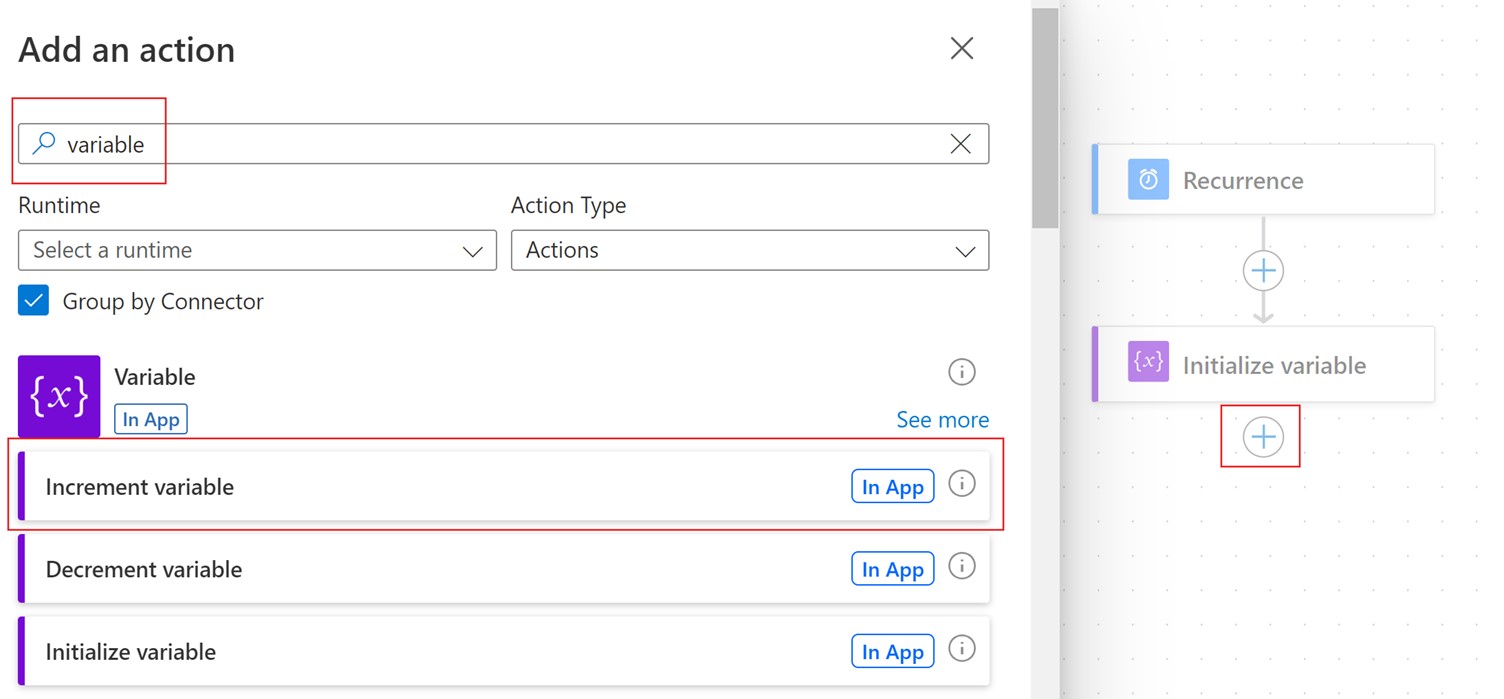
Select "New Action", search for "variable" and select the "Increment variable" option under the Variable heading.
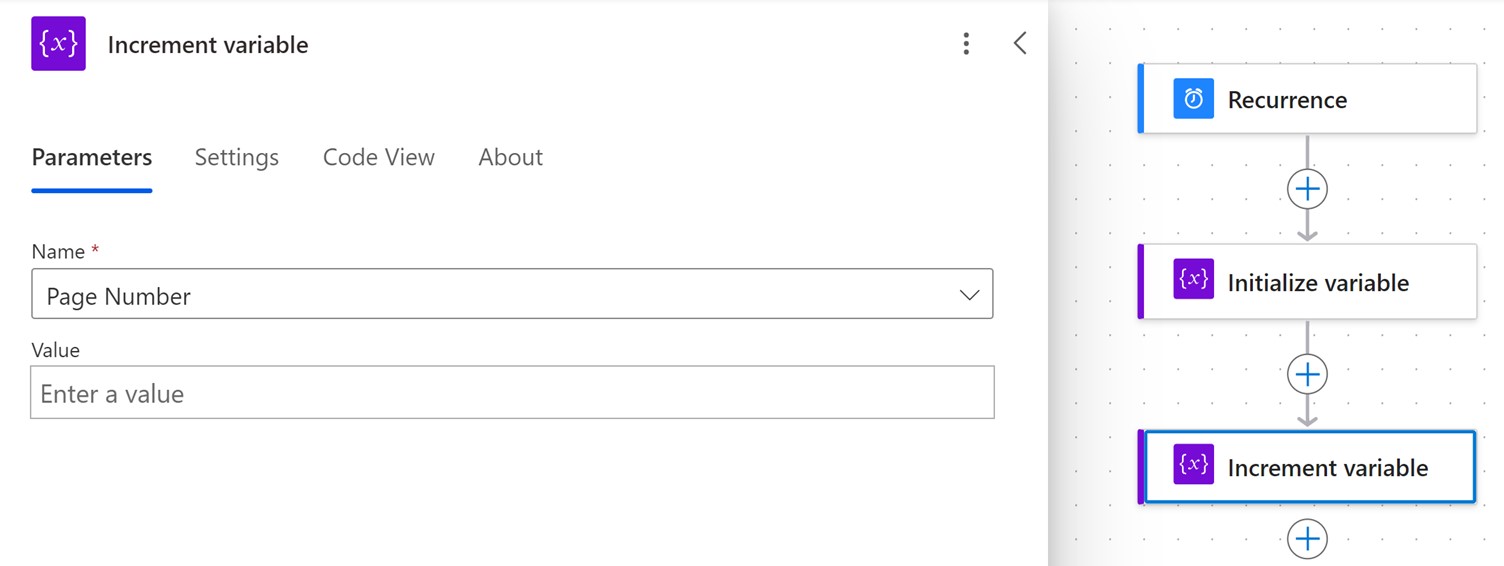
Under the name dropdown, select the initialized variable "Page Number" defined previously and fill in the value as 1.
Getting Your Data
To request data from Connect you'll need to select "New Action", search for "http" and select the "HTTP" option under the HTTP heading.
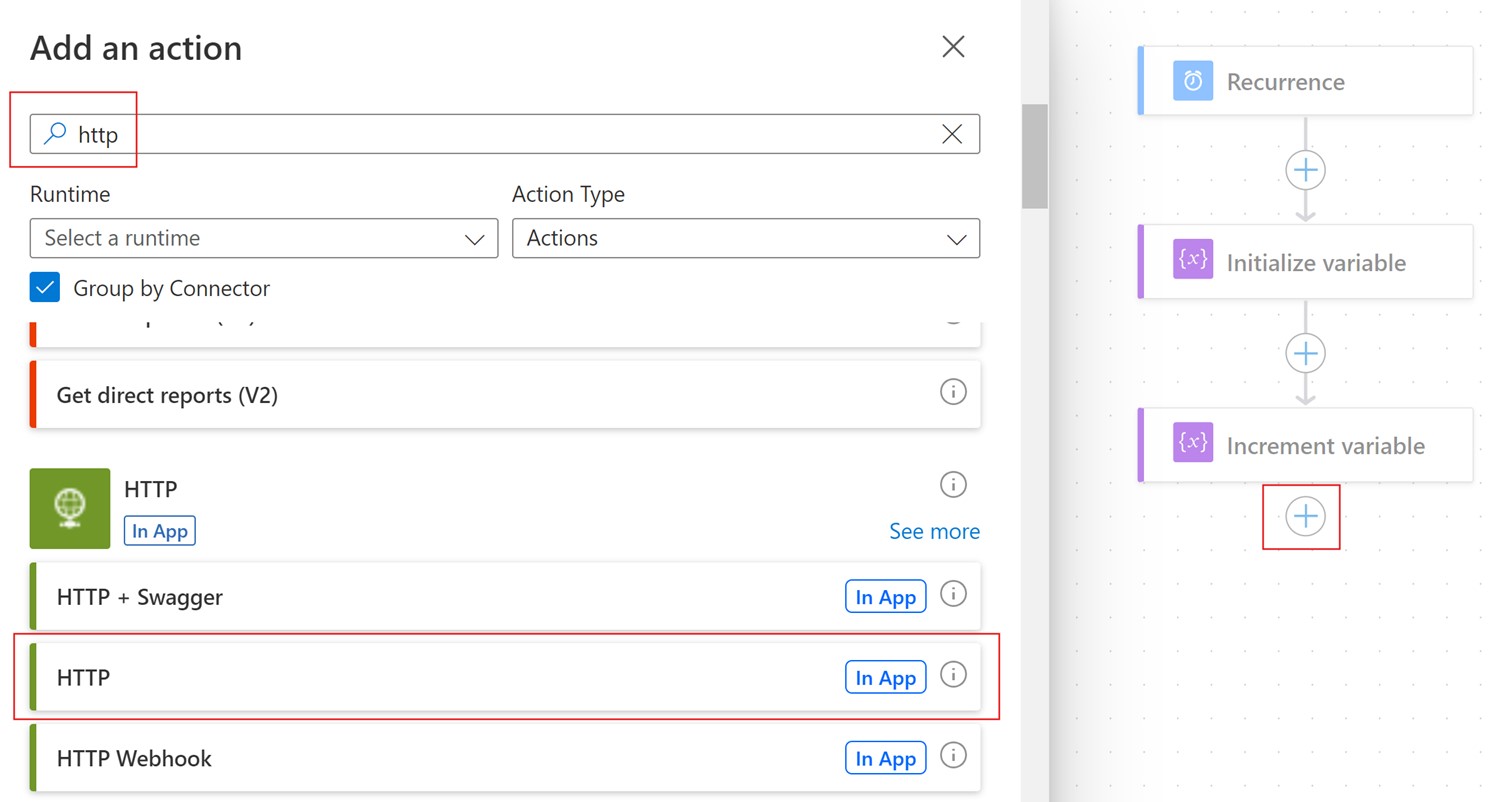
Fill out the HTTP step as follows. You'll need a method, URI, and some headers. In the form under the HTTP section, fill out the URI, Method and Headers as follows.
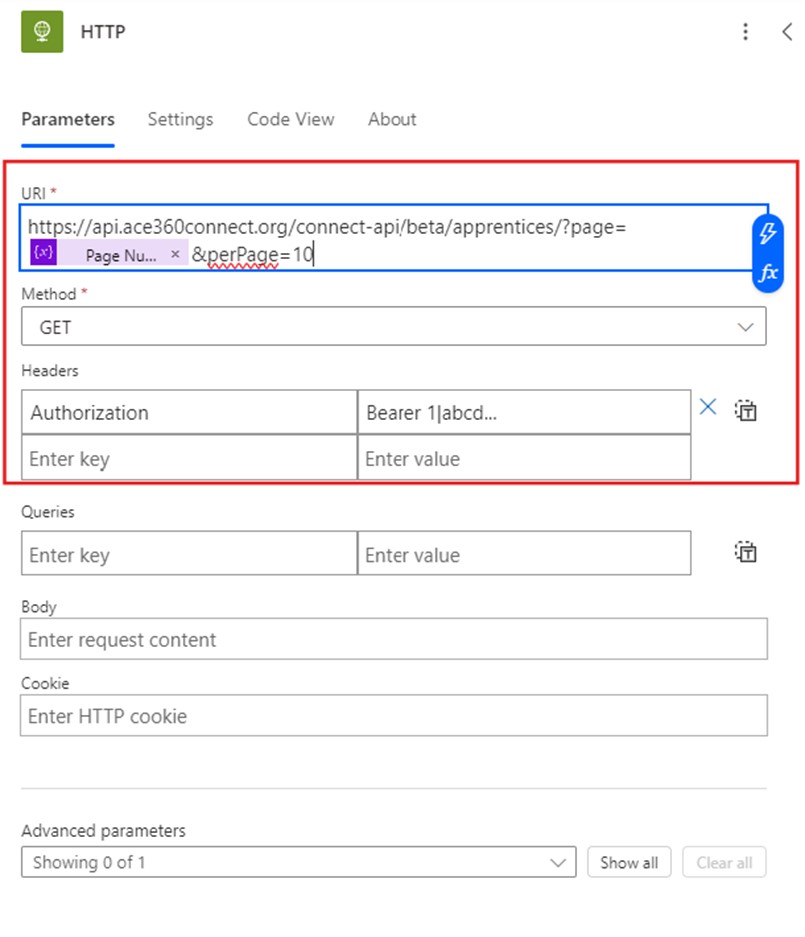
Be sure to enter your own token like so "Bearer 2|abcd...." (don't include the quotes).
You also need to set the page to the previously defined initialized variable and set how many apprentices you need perPage.
Processing Your Data
Before you can work with your data, you'll need to do a bit of processing. This involves selecting the data that the API has sent us, and parsing that response so we can manipulate it. Don't worry, Power Automate can do this for us.
Select "New Action", search for "json" and select the "Parse JSON" option under the Data Operation heading.
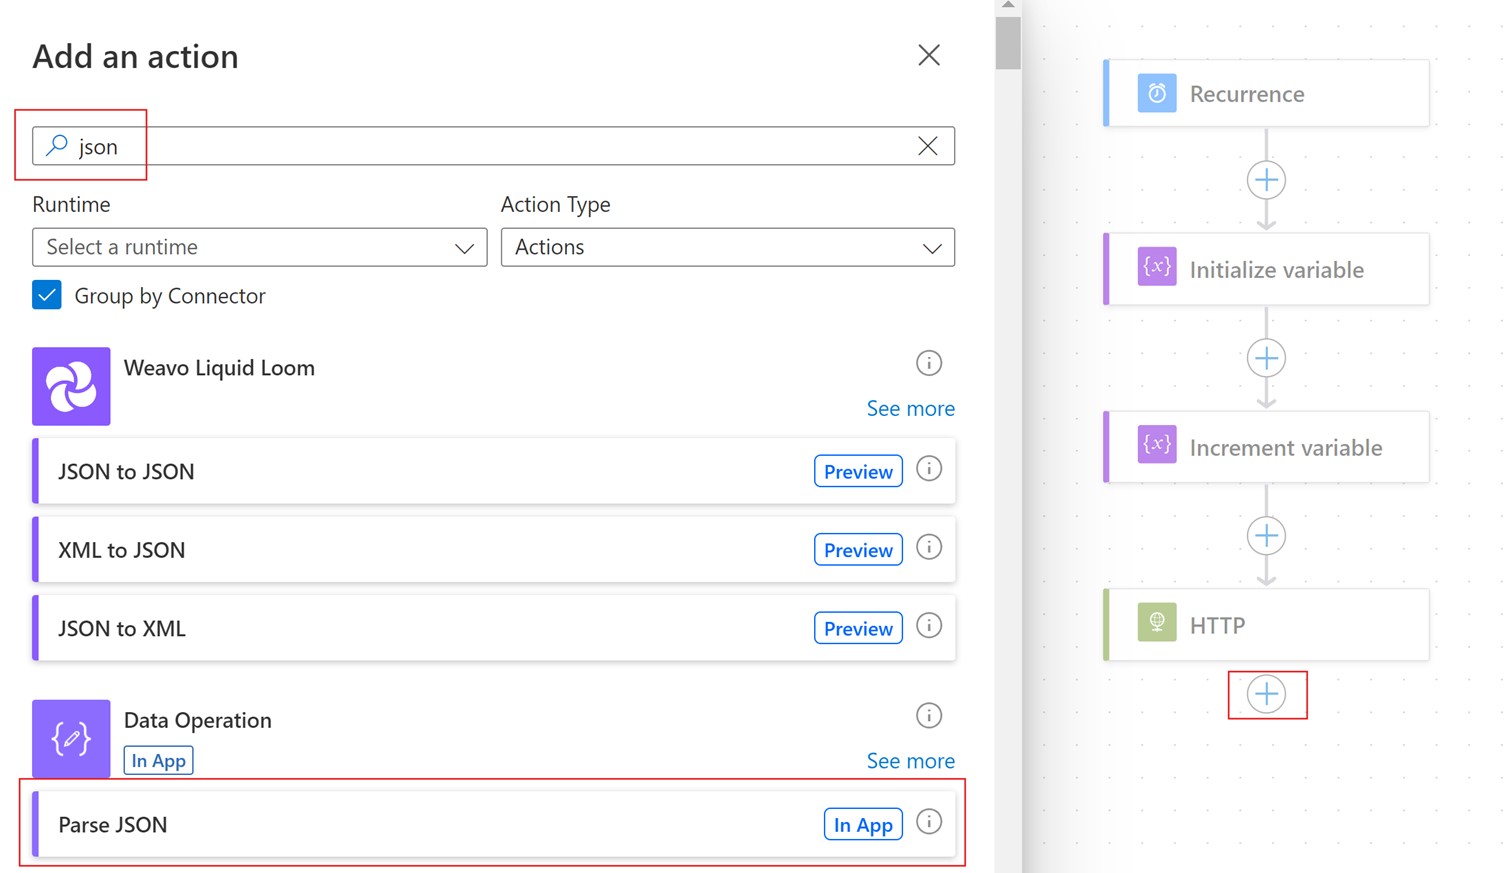
You need to tell the JSON parser to collect the data or "body" from the Http request.
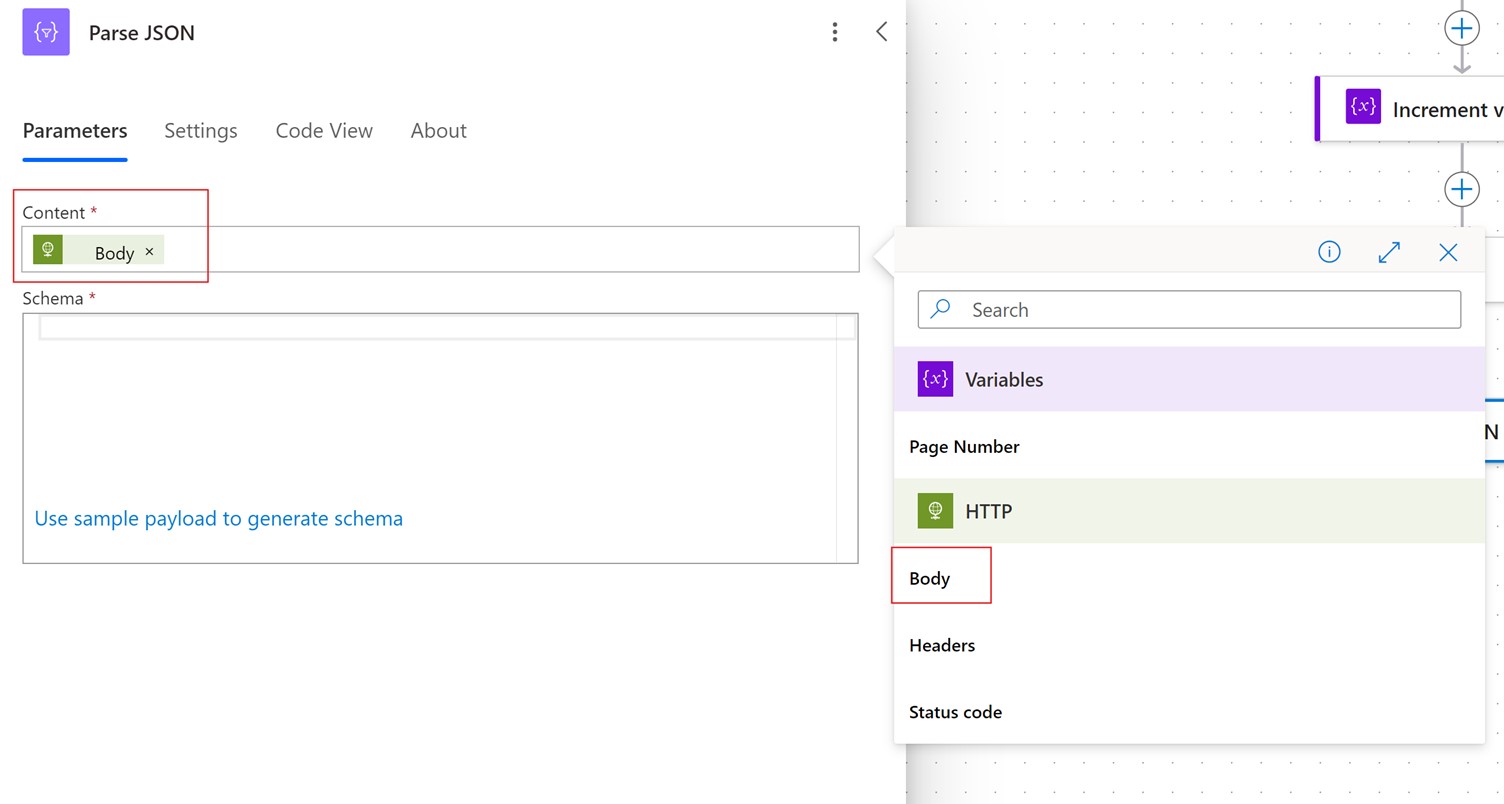
TIP: Use the little lightning bolt to select available options.
You'll also need to generate a schema for it to interpret the data. Click the link under the big empty box that says "Use sample payload to generate schema" and paste the following into the window that will have opened.
{
  "total": null,
  "currentPage": null,
  "perPage": null,
  "totalPages": null,
  "data": [
    {
      "id": null,
      "ulnNumber": null,
      "firstName": null,
      "lastName": null,
      "dateOfBirth": null,
      "standardId": null,
      "status": {
        "id": null,
        "text": null
      },
      "tpoId": null,
      "epaoRegisteredDate": null,
      "estimatedStartDate": null,
      "estimatedEndDate": null,
      "esfaCertificateClaimedAt": null,
      "estimatedGatewayAtEpaoRegistration": null,
      "approvedForEpaDate": null,
      "provisionalGrade": null,
      "epaOverallGrade": null,
      "gradeDate": null,
      "createdAt": null,
      "archivedAt": null,
      "withdrawnAt": null,
      "archivalStatus": null,
      "epaoInternalId": null,
      "epaoId": null
    }
  ]
}
It should look something like this:
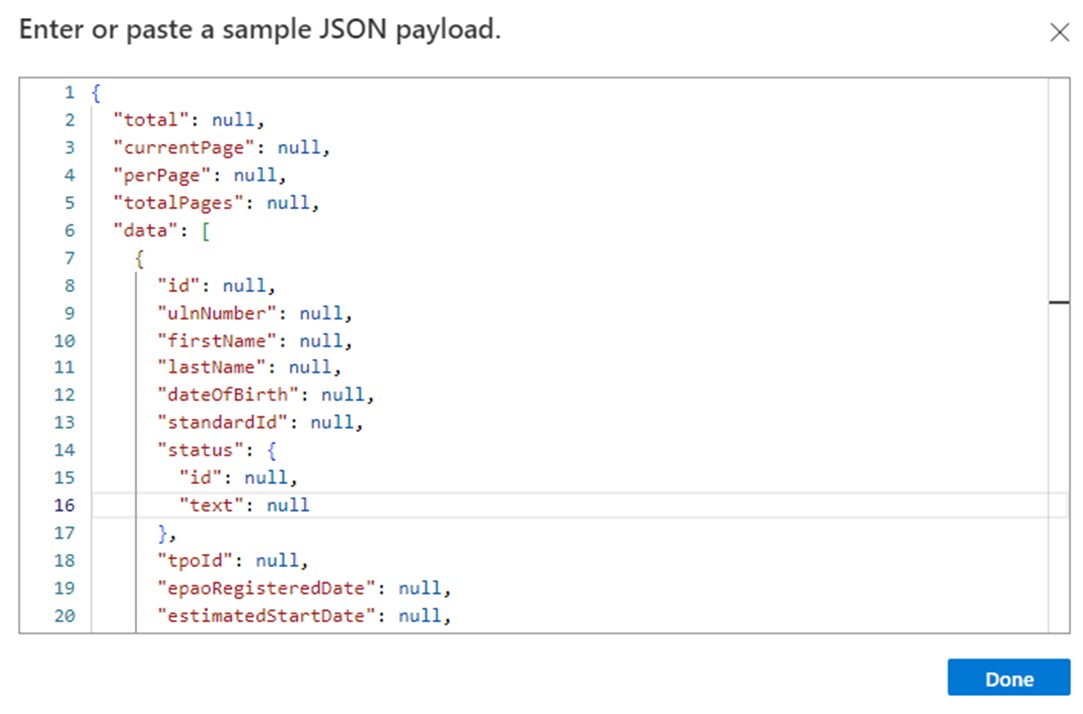
Clicking done will fill the previously empty box with a schema that Power Automate can understand.
Iterating Your Data
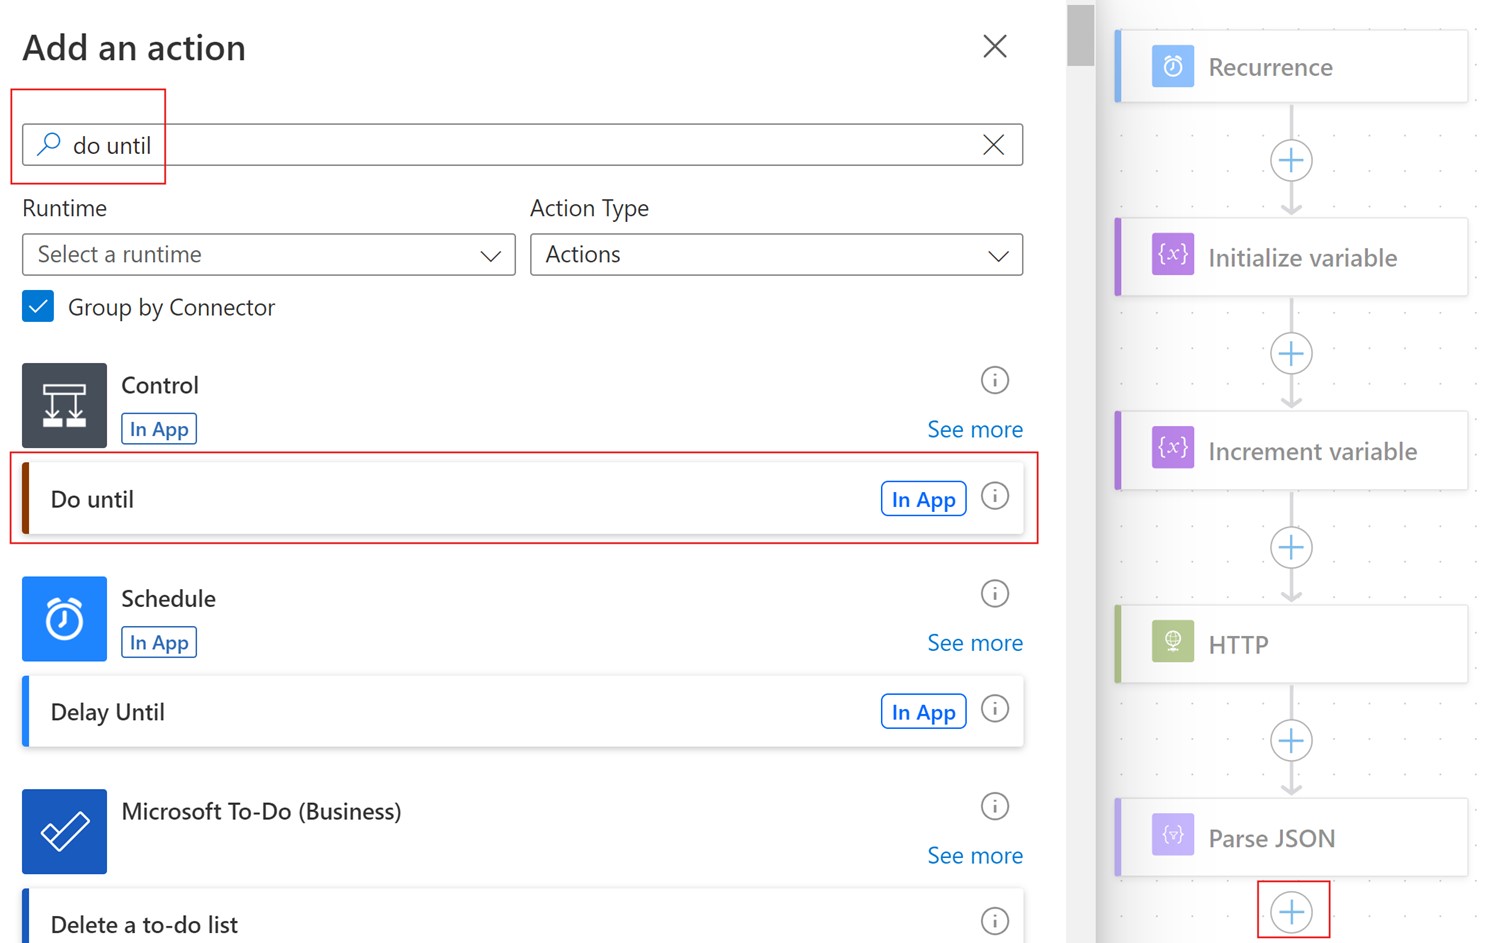
To iterate through all the apprentices you need to loop the API call for each page. Select "New Action", search for "do until" and select the "Do Until" option under the Control heading.
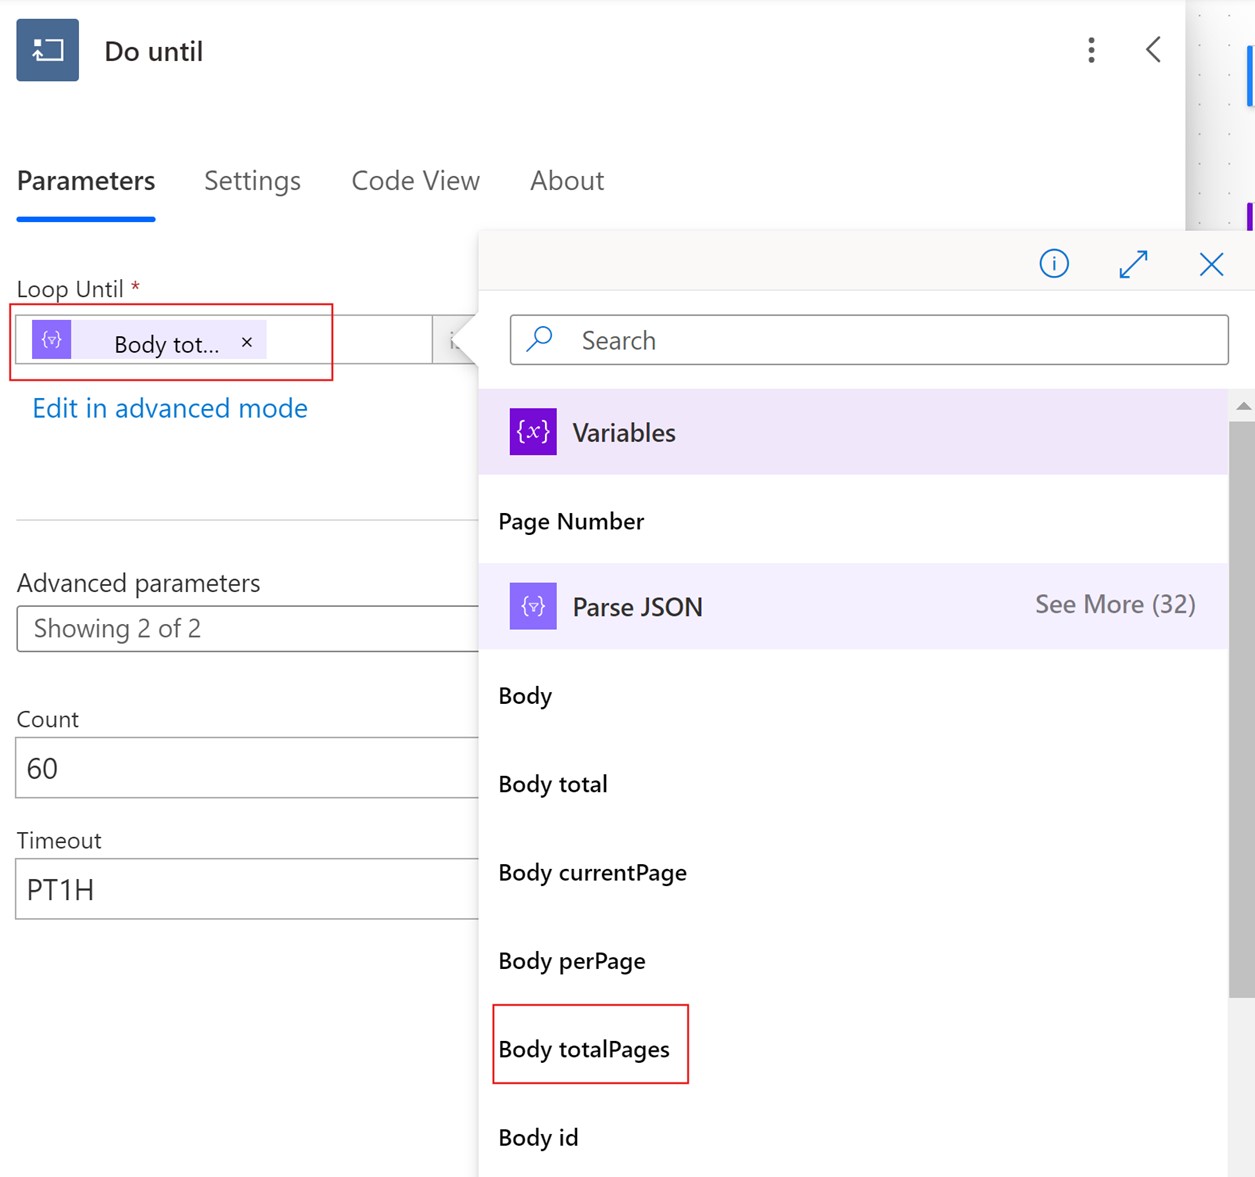
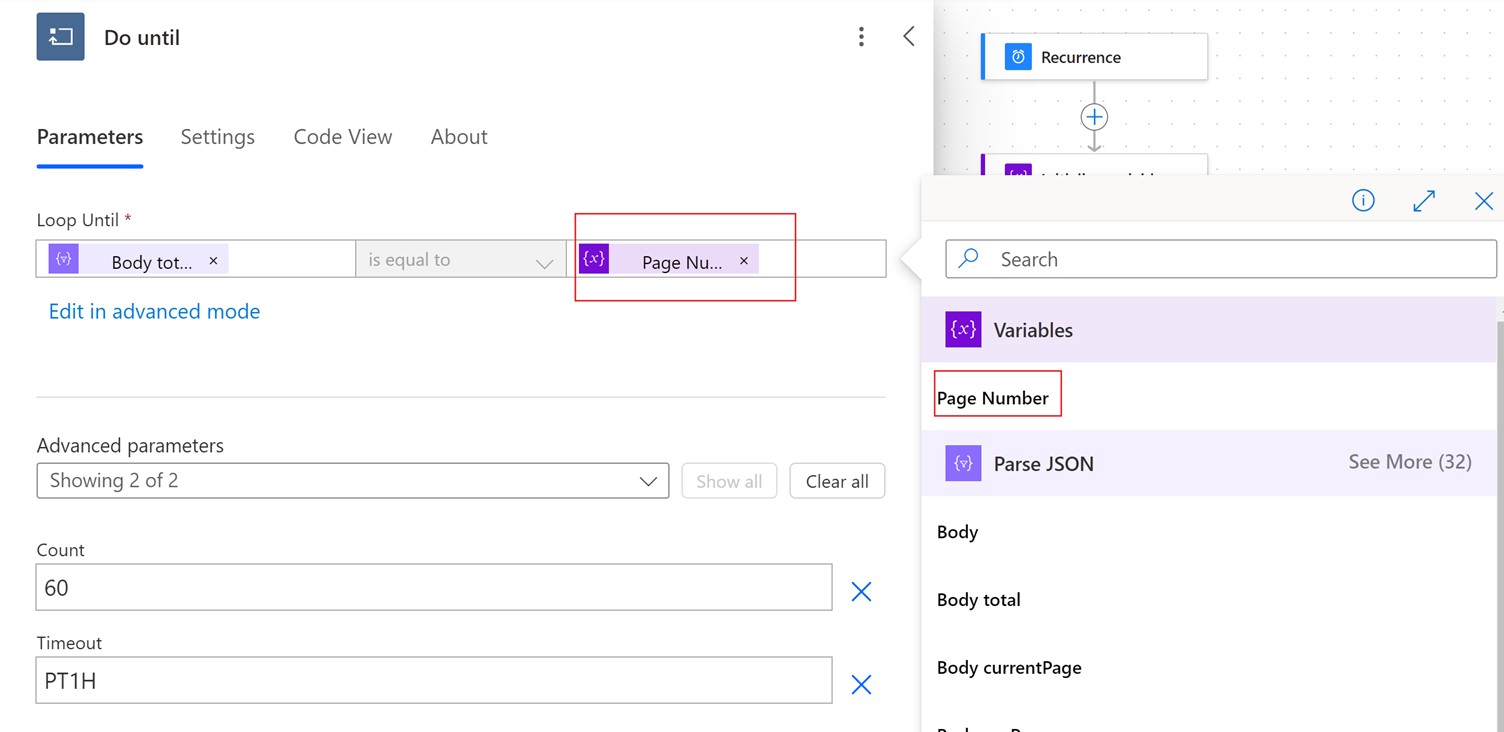
Set the loop to run until the increment variable you defined earlier is equal to the total pages.
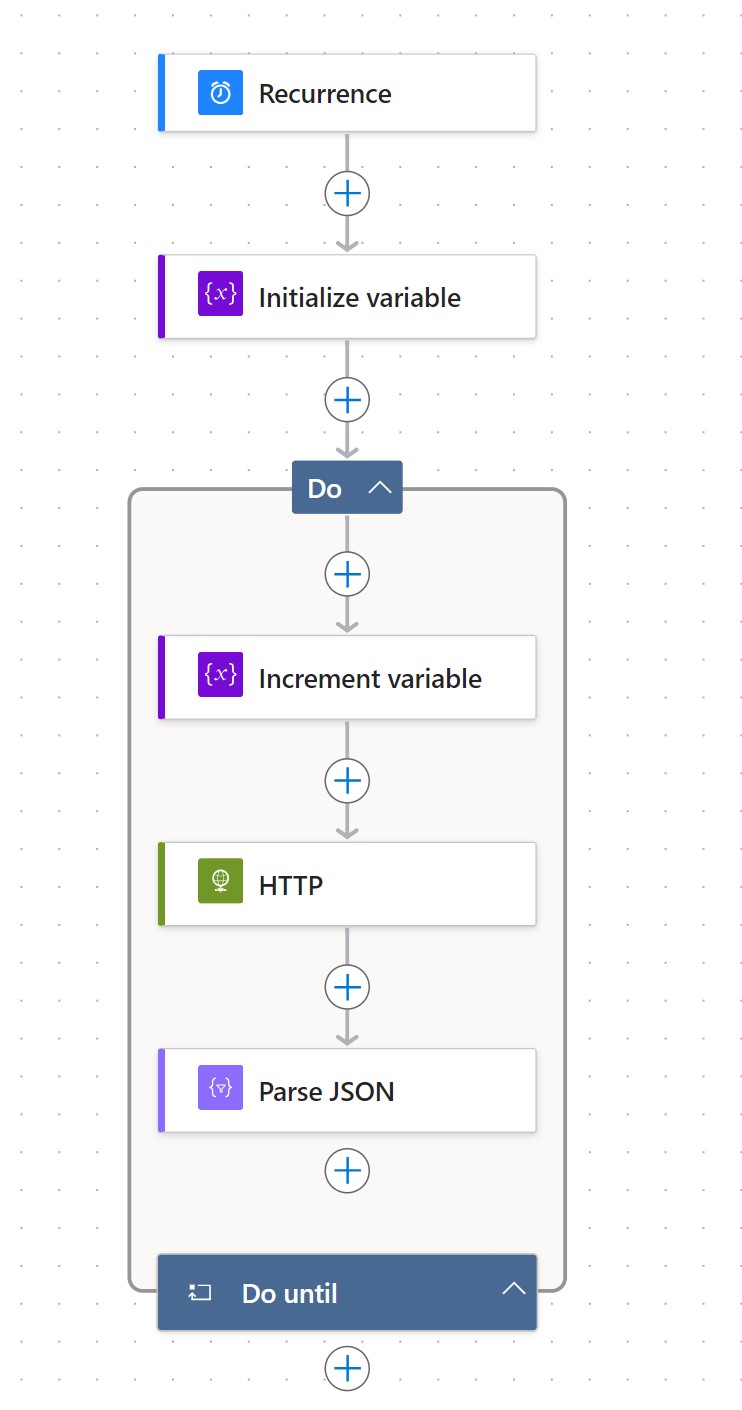
Drag the Increment variable, HTTP and Parse JSON actions within the DO until action like shown below.
Building Your Excel Report
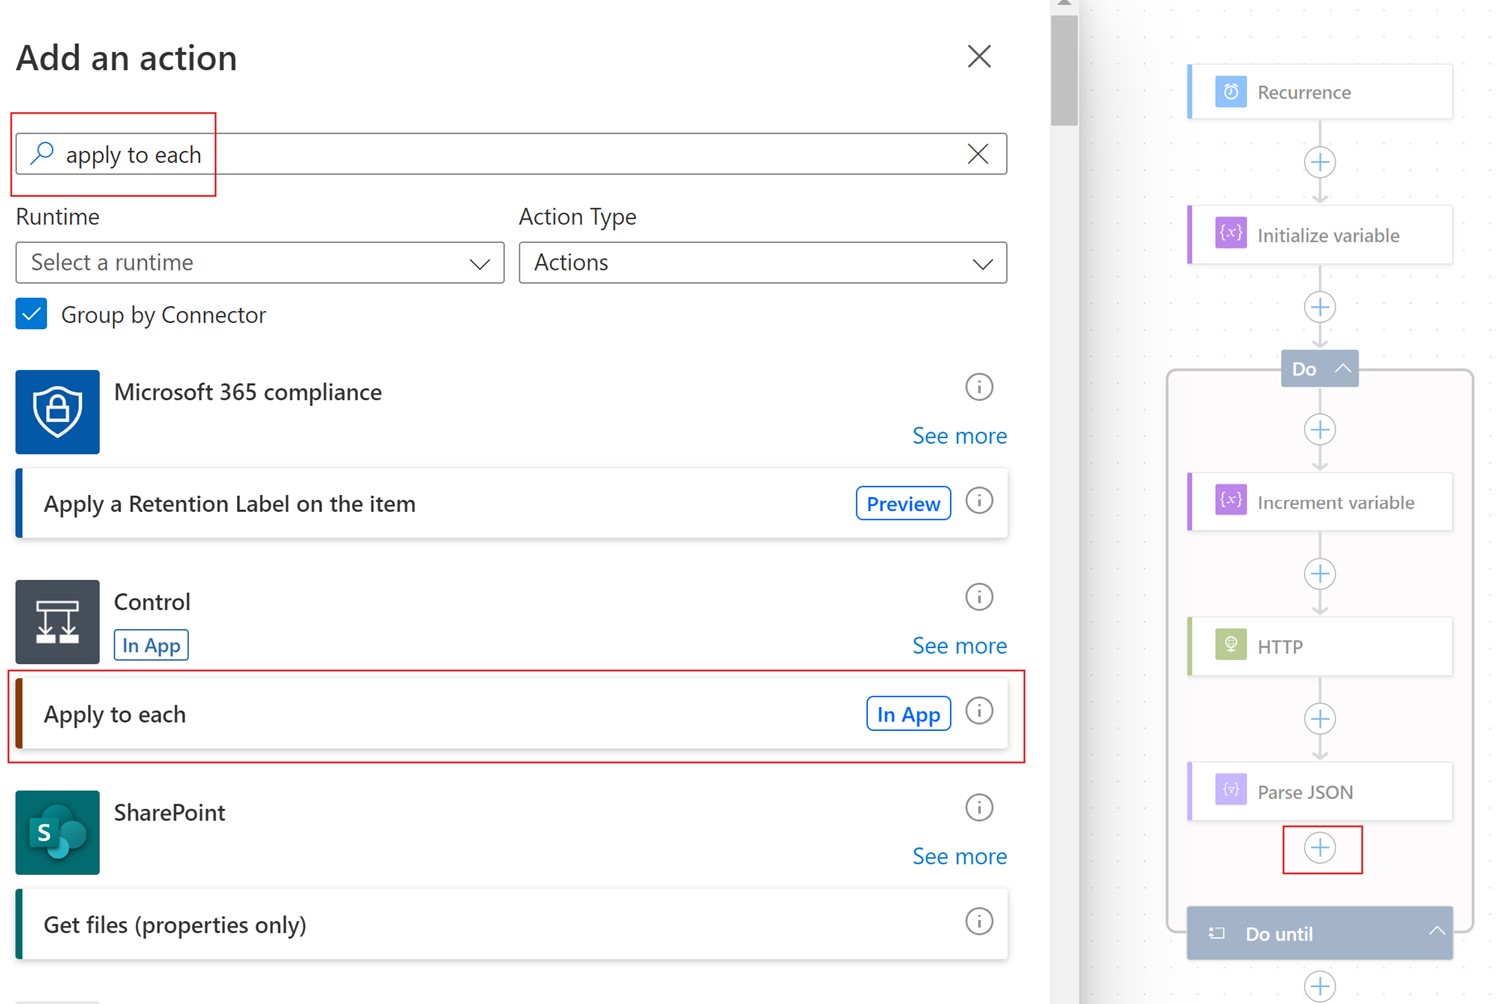
The json response from Connect will contain many apprentices. You will want to write each of these apprentices to your Excel report. To do that, you'll need to loop through each apprentice. Select "New Action", search for "apply to each" and select the "Apply to each" option under the Control heading.
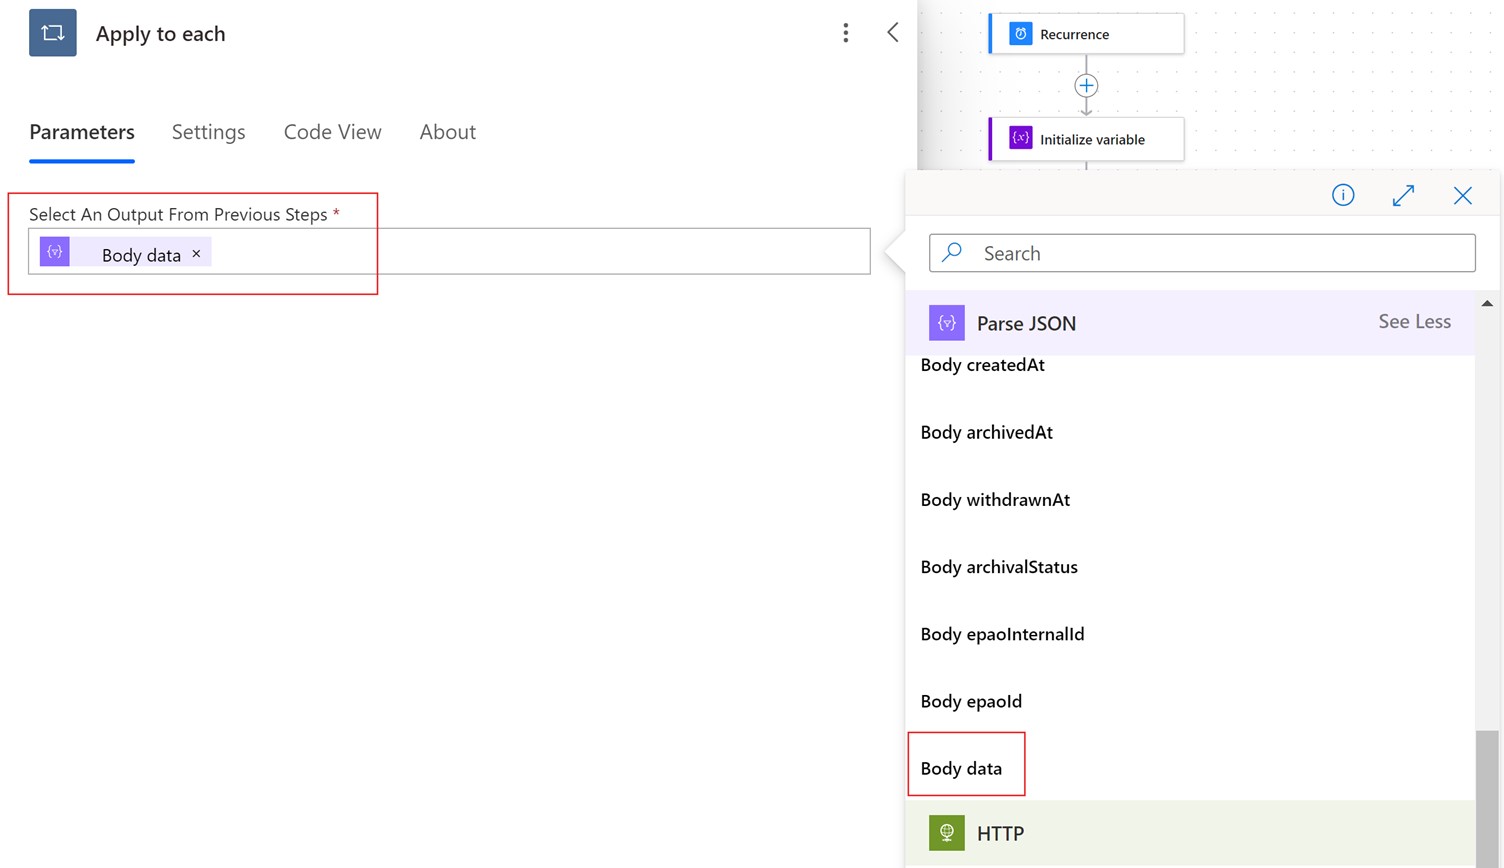
Select the "Body data" from the parse json step as your output in the dropdown.
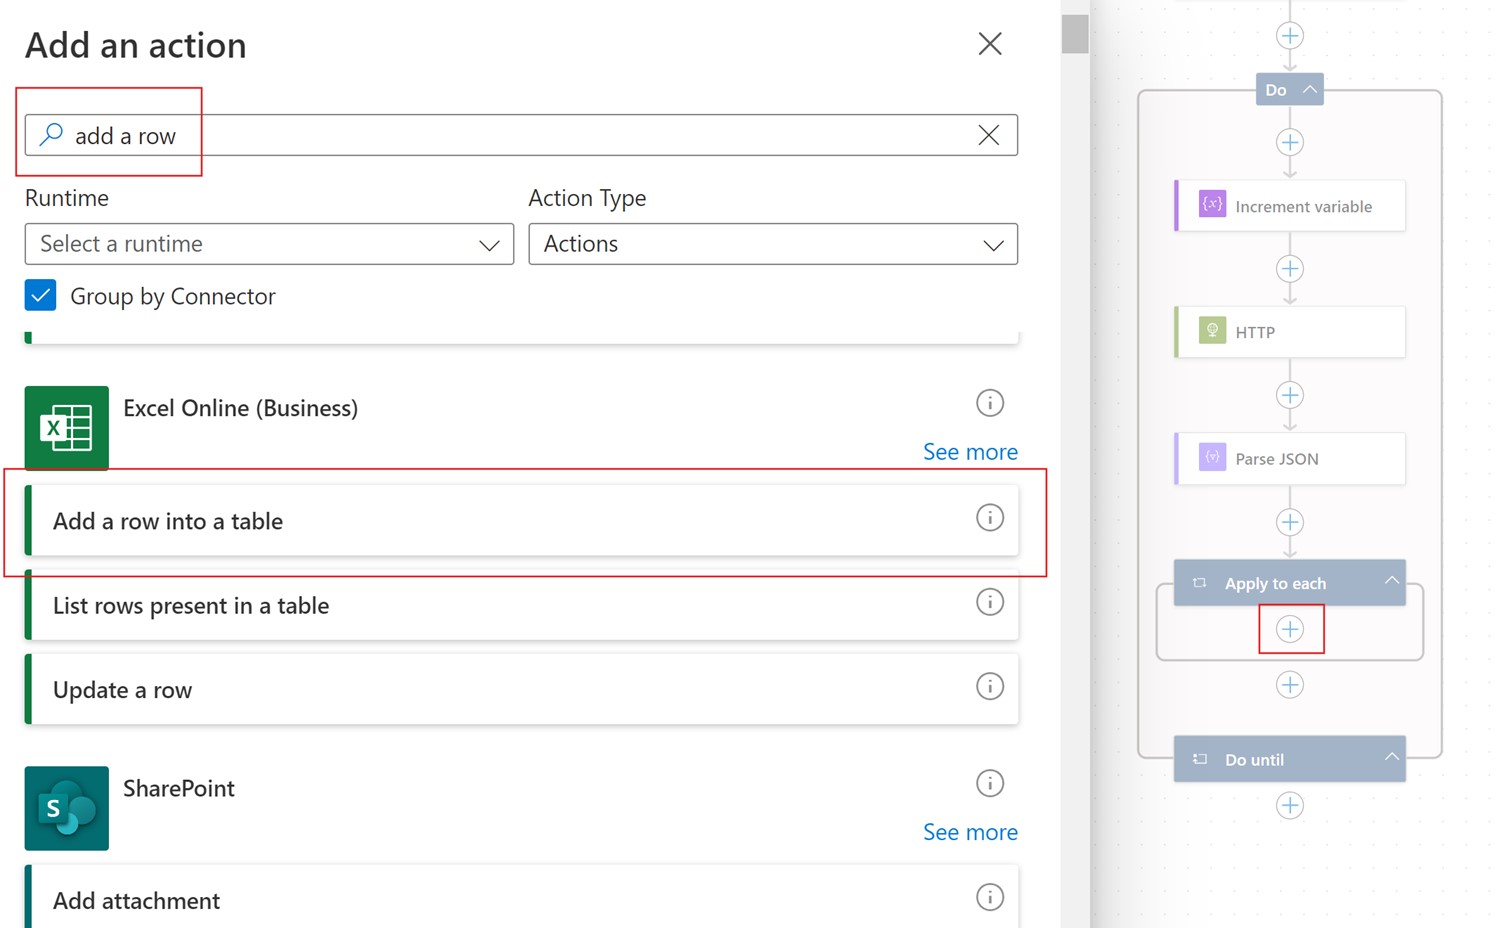
Under the apply to each action, select "New Action", search for "add a row" and select the "Add a row into a table" option under the Control heading.
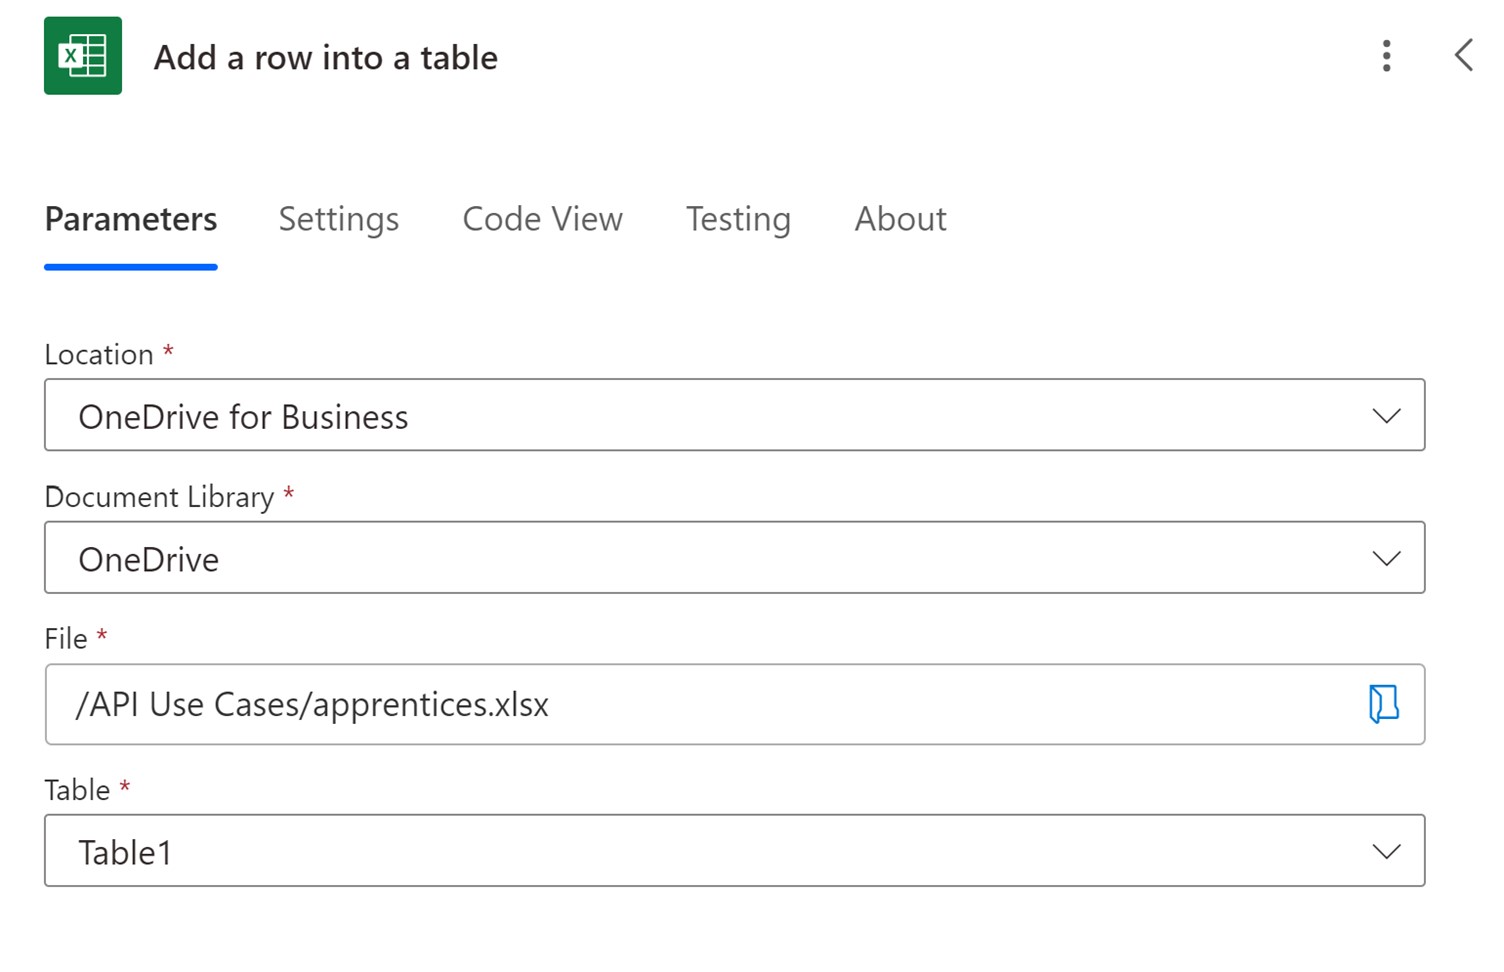
In this example we're making use of an Excel workbook with a table that lives on our OneDrive. Though you can make use of SharePoint if you'd prefer.
Our Excel workbook started life looking as a blank table with the name "Table1".
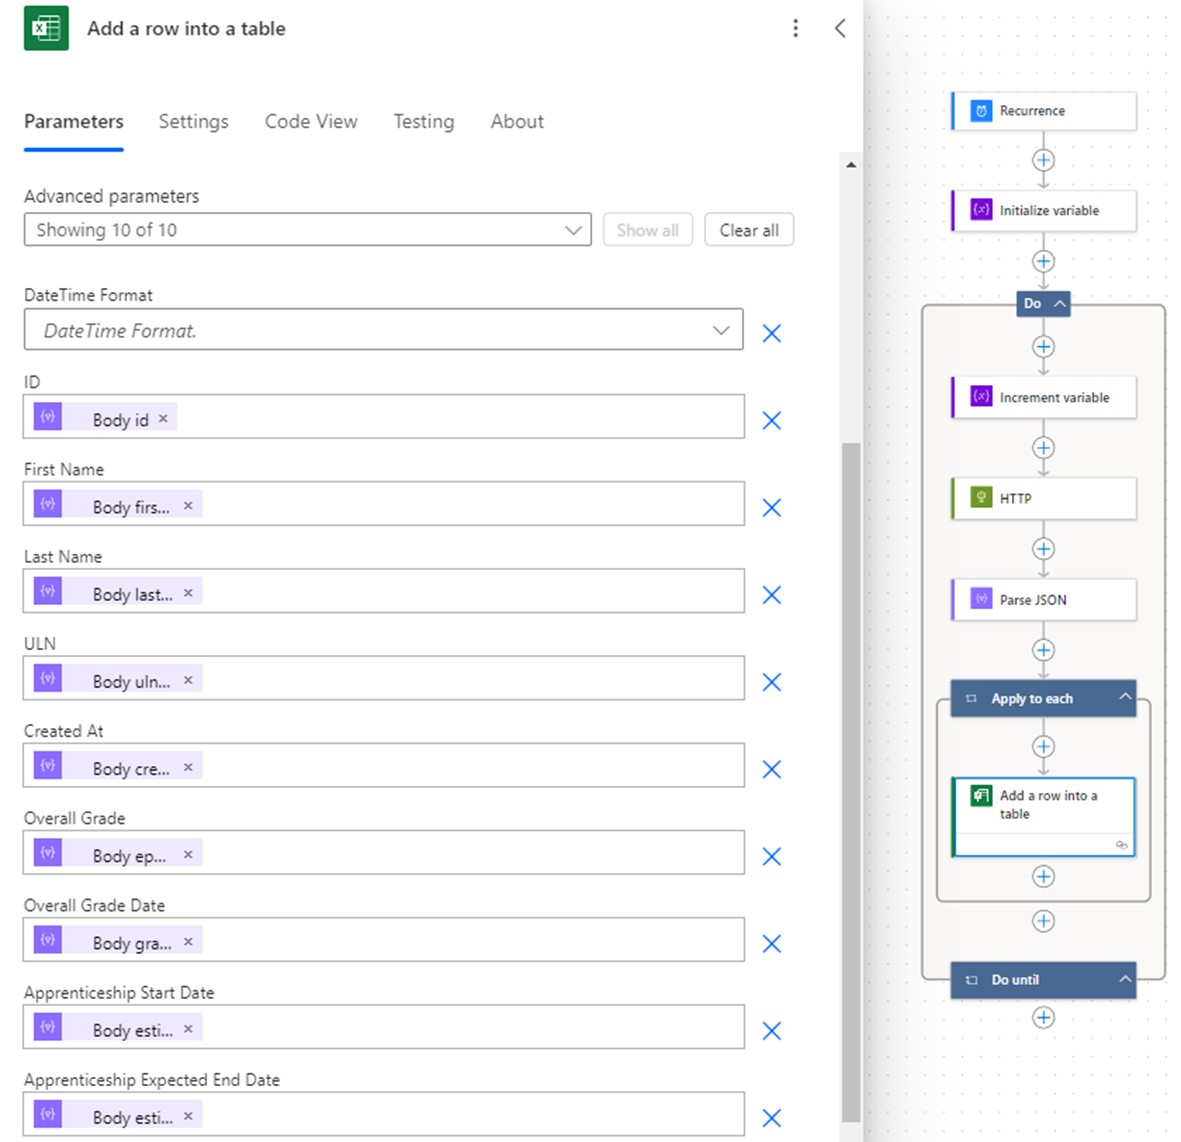
Once the table has been found by Power Automate you'll be able to assign data to fields, your config should look something like this:
In the same section, under Advanced parameters, click on "Show all" to list out all the fields from your excel table. Once you've assigned the right json fields to correct columns, "Save" your flow.
Assuming your flow saved without errors, it's time to test your new flow.
Using the toolbar at the top right of the screen click "Test".

Under your test flow sidebar, click "Manually", then "Test", "Run flow" and finally "Done".
It'll take a minute but your flow should run. Keep an eye on your Excel workbook and on the status of your flow.
After a minute or so you should start seeing entries appearing in your Excel report.

And that's the basics of getting data from ACE360 Connect into a simple Excel workbook.
Summary
By following this tutorial you should now be able to create simple Excel reports using Power Automate. The example we provided here won't be particularly clever but serves to give you a basic understanding of how to get data from ACE360 Connect and start manipulating it.
Next Steps
Now you know how to build simple Excel reports. We'd recommend that you duplicate the report and experiment with checking for existing values, removing older unwanted data, and filling out more than one table. You could even start experimenting with our API filters to trim down the data you receive from Connect.
Need Inspiriation?
We've got an automated email guide coming soon!
Are you a Power BI user?
Check out our basic Power BI report tutorial.
 ACE360 Connect Documentation